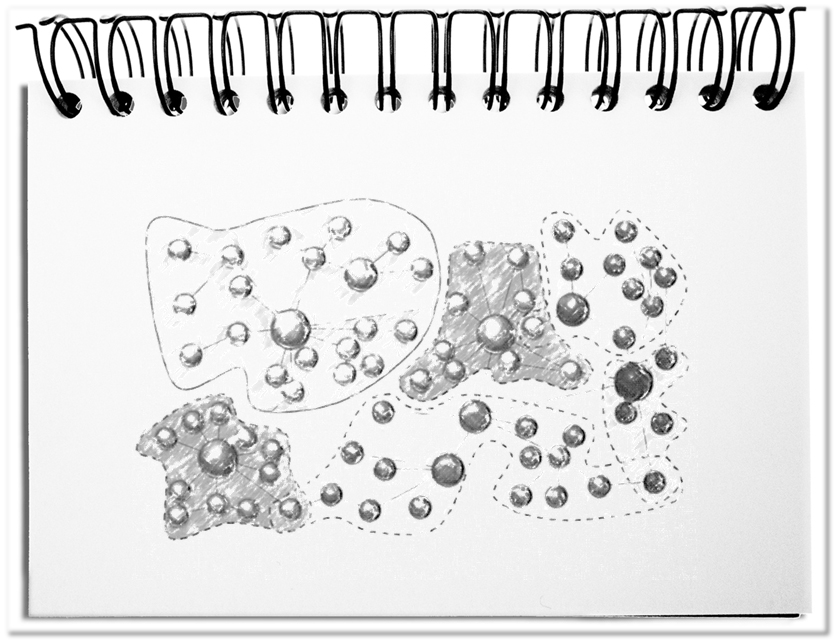
The boundaries of companies dissolve in favor of cross-border networks. Actors and relationships, interests and data, expectations and information, business models and knowledge find their way on the Internet. Joining an online community can make the difference for individuals and groups. Whether private or business – it is helpful to know the new realities, the properties of a network.
The effects of the net can be better exploited, if you know its characteristics.
- Size
The number of actors/nodes amount to the size of the network. The more participants, the greater the benefit of the network. Additional offers, which exceed the actual purpose, expand the scope of application. A historical example illustrates the importance of size: the more people with a telephone, the more people can be reached, the more people have a telephone and the more services (e.g. information, routing, wake-up calls, telephone counseling) can be marketed. Based on the Dunbar number, the natural limit of social relationships is 150 persons, between 100 and 250. Based on the average number of Facebook friends per user of over 300 (between 250 and 500) you can presume that in the social networks of the Internet the Dunbar number doubles. - Density
The actors become interconnected with one another to a more or less close meshed network. The number of actual relationships between the actors/nodes together with the possible number of connections determine the density of meshing. If the resulting connectivity is very dense, the network has a great impact on each individual. Loose attachment appears in the lack of social relationships and subsequently with frustration as well as isolation. The density can be represented by the number of relationships in respect to the possible relationships – e.g. a network of 8 people has (8-1) * (8/2) = 28 possible relationships; in this example all people are centrally only linked to one person, but not to each other, resulting in 7 relationships; this corresponds to a density of 0.25. - Openness
The relationships that get out of the network determine the degree of openness. Prerequisite is the definition of the network boundaries. In companies, they are today much more permeable due to partnerships, joint ventures and outsourcing. The project relationships lead to frequent changes of the network members. The openness results from the number of external relationships in respect to the possible relationships. They are double-edged. On the one hand, a network gains new ideas and members through openness. On the other hand, experiences and insights unintentionally flow out of the network, and people get the opportunity to exert undesirable influence through openness. - Perseverance
Networks have a certain life of their own because of the large number of actors. Perseverance describes the degree of stability. It results from the increase of members and relationships, the changing degree of formal structure, and the general direction, i.e. growth, consolidation or shrinkage of the network Too much change endangers the perseverance and results in the formation of new networks or internal group building. - Speed
The time it takes to bring insights to all nodes defines the speed. This information flows through the relationships. With respective channels, actors can communicate in different ways, such as email, intranet, or by exchanging ideas. The distribution can take place by pull or push principle. The pull principle is based on information needs – knowledge is obligation to search; trigger is the target audience; mostly bottom-up. The push principle is aligned to the needs for informing – knowledge is an obligation to deliver; triggers are the information sources; mostly top-down. Built-in feedback, such as receipt confirmation or collection of comments, allow assumptions about the speed.
Bottom line: The network is the most likely organizational format in times of VUCA. The membership benefits are determined primarily by the number of users. Other characteristics are the density, openness, perseverance and the speed of the information flow. Although the network properties allow a better control, it is still necessary to continuously observe and evaluate the network due to the self-organizing members.


